
Learning how to analyze stocks is crucial for smart investors seeking to maximize returns and mitigate risk. This comprehensive guide provides a practical framework for understanding stock analysis, empowering you to make informed investment decisions. We’ll cover essential stock analysis techniques, including fundamental analysis, technical analysis, and quantitative analysis, equipping you with the knowledge to effectively evaluate company performance, market trends, and investment opportunities. Whether you’re a seasoned investor or just starting, this guide will provide valuable insights into the world of stock market analysis.
Fundamental vs. Technical Analysis: Understanding the Differences
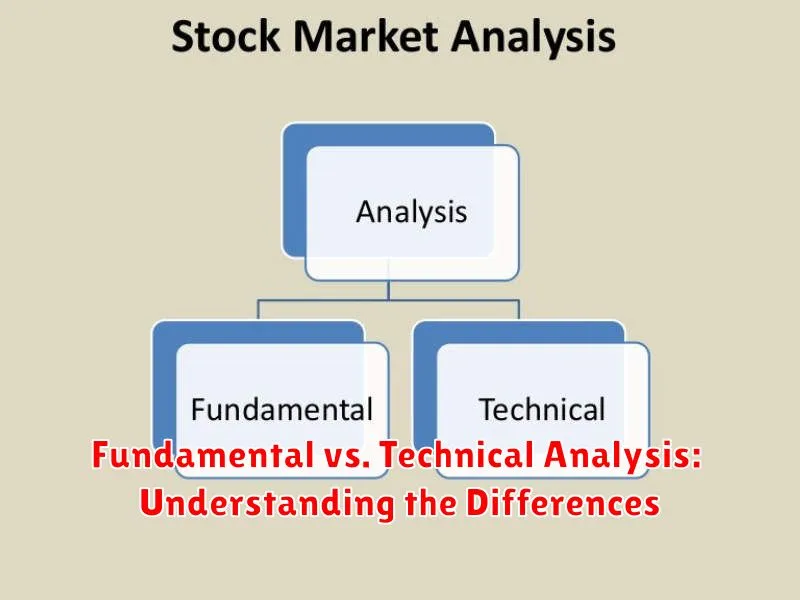
Fundamental analysis focuses on evaluating the intrinsic value of a company. It involves examining factors like a company’s financial statements, management quality, competitive landscape, and industry trends to determine if a stock is undervalued or overvalued.
Technical analysis, conversely, focuses on the price and volume of a stock to predict future price movements. It utilizes charts, graphs, and various indicators to identify trends, support levels, and resistance levels, disregarding the company’s underlying fundamentals.
The key difference lies in their approach: fundamental analysis is a long-term perspective, focusing on the company’s inherent worth; technical analysis is a short- to medium-term perspective, focusing on market sentiment and price patterns. Both methods can be valuable tools for investors, but they offer different insights and should be used strategically.
Fundamental analysis is suitable for investors with a longer-term investment horizon who seek to identify undervalued companies. Technical analysis is better suited for investors who prefer shorter-term trading strategies and focus on market timing.
Key Financial Ratios to Evaluate Stocks
Analyzing a company’s financial health is crucial before investing. Key financial ratios provide a standardized way to compare performance across different companies and over time. Understanding these ratios allows investors to make informed decisions.
Profitability ratios, such as gross profit margin and net profit margin, reveal how efficiently a company converts sales into profit. A higher margin generally indicates better profitability.
Liquidity ratios, including the current ratio and quick ratio, assess a company’s ability to meet its short-term obligations. A healthy ratio suggests the company can pay its bills.
Solvency ratios, like the debt-to-equity ratio and interest coverage ratio, measure a company’s ability to manage its long-term debt. Lower debt levels generally indicate lower risk.
Efficiency ratios, such as inventory turnover and asset turnover, reflect how effectively a company uses its assets to generate sales. Higher turnover often signifies efficient operations.
Valuation ratios, including the price-to-earnings ratio (P/E) and price-to-book ratio (P/B), compare a company’s market value to its fundamentals. These help determine if a stock is overvalued or undervalued.
It’s important to note that no single ratio tells the whole story. A comprehensive analysis requires examining multiple ratios in conjunction with other qualitative factors, such as management quality and industry trends, to gain a holistic understanding of a company’s financial standing and potential.
How to Read Stock Charts and Market Trends
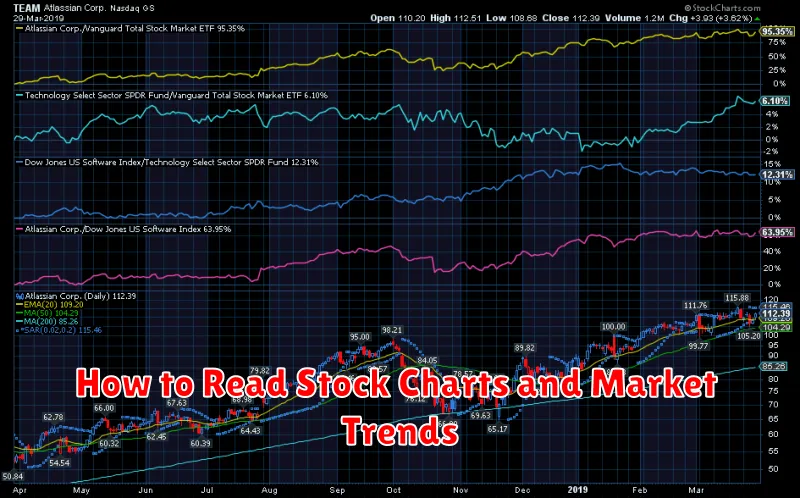
Understanding stock charts is crucial for analyzing market trends and making informed investment decisions. Stock charts visually represent a stock’s price movements over time, typically displaying open, high, low, and closing prices (OHLC) for each period (daily, weekly, or monthly).
Candlestick charts are a common type, where each candle represents a period’s price range. Green candles indicate a closing price higher than the opening price (uptrend), while red candles show the opposite (downtrend). Line charts simply connect closing prices, showing the overall trend.
Analyzing trend lines, which connect a series of highs or lows, helps identify the overall direction of the market. Support levels represent price points where buying pressure tends to outweigh selling pressure, preventing further declines. Conversely, resistance levels are price points where selling pressure dominates, hindering further price increases.
Volume, displayed alongside price data, provides crucial context. High volume during an uptrend confirms strength, while high volume during a downtrend suggests weakness. Conversely, low volume during a trend may signal a potential trend reversal.
Moving averages, such as the 50-day and 200-day moving averages, smooth out price fluctuations and highlight underlying trends. Crossovers of these averages can indicate potential buy or sell signals, but should be used in conjunction with other technical indicators.
Remember that chart analysis is only one piece of the investment puzzle. Combine chart analysis with fundamental analysis (examining a company’s financial health) for a more comprehensive investment strategy. Always consider your own risk tolerance and diversify your portfolio.
The Role of Earnings Reports in Stock Evaluation
Earnings reports are crucial for stock evaluation, providing a snapshot of a company’s financial performance over a specific period. They reveal key metrics like revenue, net income, earnings per share (EPS), and profit margins. Analyzing these figures helps investors understand a company’s profitability and growth trajectory.
Investors compare reported figures to analyst expectations and previous periods’ results to gauge performance. Positive surprises (exceeding expectations) often lead to a stock price increase, while negative surprises usually result in a decrease. However, it’s crucial to analyze the underlying factors contributing to the results, not just the headline numbers.
Beyond the headline figures, careful examination of the earnings release and the subsequent conference call provides further insights. This includes details about operational efficiency, future guidance (management’s outlook), and significant events impacting performance. Understanding these elements is vital for making informed investment decisions.
It’s important to remember that earnings reports are only one piece of the puzzle. While fundamental analysis incorporating earnings data is essential, investors should consider other factors, such as market conditions, industry trends, and the company’s competitive landscape, to obtain a comprehensive view before making investment decisions.
How to Identify Undervalued Stocks
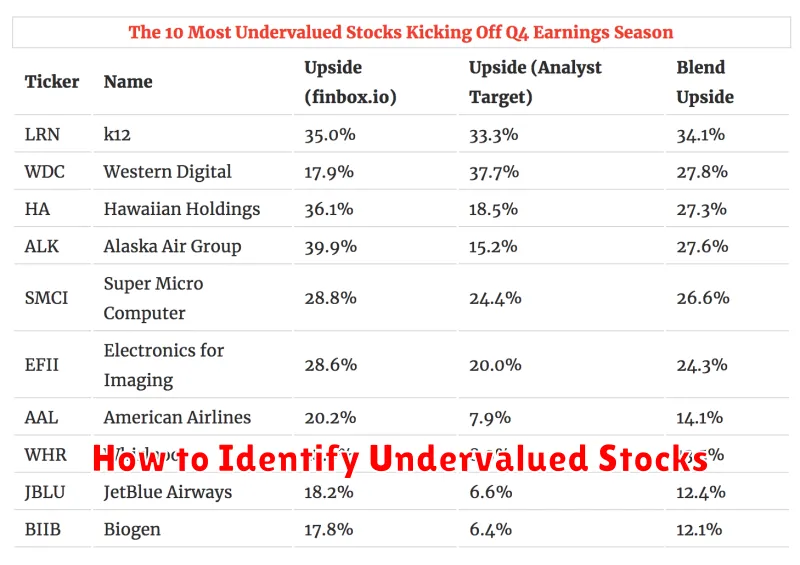
Identifying undervalued stocks requires a combination of fundamental and technical analysis. Begin by assessing the company’s financial health using metrics like the price-to-earnings ratio (P/E), price-to-book ratio (P/B), and dividend yield. A lower P/E ratio compared to industry peers or historical averages could suggest undervaluation, but always consider the company’s growth prospects.
Compare the company’s intrinsic value, estimated through discounted cash flow (DCF) analysis or other valuation methods, to its current market price. If the intrinsic value significantly exceeds the market price, it may indicate undervaluation. However, remember that DCF analysis relies on assumptions about future cash flows, which can be uncertain.
Analyze the company’s competitive landscape. A strong competitive advantage (e.g., a strong brand, unique technology, or cost leadership) can contribute to future growth and justify a higher valuation. Consider factors like management quality and the overall economic environment. Undervaluation is rarely isolated from broader market trends or industry-specific factors.
Technical analysis can offer supplementary insights. While not definitive, observing trading patterns and volume can reveal potential buying opportunities. However, relying solely on technical indicators is risky; they should complement fundamental analysis.
Finally, remember that no valuation method is perfect. Even thorough analysis can’t guarantee future performance. Diversification and a long-term investment horizon are essential to mitigate risk.
Using Macroeconomic Indicators to Predict Market Trends
Analyzing macroeconomic indicators is crucial for predicting market trends and making informed investment decisions. Key indicators include Gross Domestic Product (GDP), reflecting overall economic growth; inflation rates, measuring price changes and impacting consumer spending; and interest rates, influencing borrowing costs and investment attractiveness. Understanding these indicators helps anticipate potential market shifts.
GDP growth typically correlates with stock market performance. Strong GDP suggests robust corporate earnings and increased investor confidence, potentially driving market uptrends. Conversely, slowing GDP growth can signal economic weakness and potential market downturns. Inflation affects corporate profitability and consumer spending. High inflation erodes purchasing power, potentially dampening market performance, while controlled inflation can be positive.
Interest rates play a significant role. Rising interest rates can increase borrowing costs for companies, reducing investment and potentially slowing market growth. Lower interest rates can stimulate borrowing and investment, potentially boosting market performance. Analyzing the interplay of these indicators provides a comprehensive view of the macroeconomic landscape and its likely impact on stock markets. Investors should consider incorporating this analysis into their broader investment strategy.
It’s important to note that macroeconomic indicators are not perfect predictors. Unexpected events and other factors can influence market trends. Therefore, a diversified investment strategy, coupled with thorough fundamental and technical analysis, is recommended for mitigating risk and maximizing returns.
The Psychology of Stock Market Investing
Successful stock market investing requires not only a solid understanding of financial analysis but also a strong grasp of your own psychology. Emotional decision-making is a significant pitfall for many investors. Fear and greed, the two most powerful emotions in the market, can lead to impulsive buying and selling, often at the worst possible times.
Fear can cause investors to sell assets during market downturns, locking in losses and missing out on potential recovery. Conversely, greed can lead to over-investment in hyped-up assets, ignoring fundamental analysis and potentially resulting in significant losses when the bubble bursts.
To mitigate these emotional biases, investors should develop a disciplined approach. This involves creating a well-defined investment strategy, sticking to it consistently, and avoiding impulsive reactions to market fluctuations. Diversification across different asset classes can also help reduce the impact of emotional responses to individual stock performance.
Furthermore, maintaining a long-term perspective is crucial. The stock market is inherently volatile; short-term fluctuations are normal. Focusing on long-term goals and ignoring daily market noise can significantly improve investment outcomes. Regularly reviewing your portfolio and adjusting your strategy based on sound financial analysis, not emotions, is key to long-term success.
Finally, consider seeking professional advice if you find it difficult to manage your emotional responses. A financial advisor can offer objective guidance and help you develop a strategy aligned with your risk tolerance and financial goals.
Common Mistakes to Avoid in Stock Analysis
One common mistake is relying solely on price. Successful stock analysis requires a comprehensive understanding of a company’s fundamentals, including its financial statements, competitive landscape, and management team.
Another frequent error is emotional investing. Fear and greed can cloud judgment, leading to impulsive decisions based on short-term market fluctuations rather than long-term value. Maintain a disciplined approach based on your analysis.
Ignoring macroeconomic factors is also detrimental. Interest rate changes, inflation, and global events significantly impact stock prices. Understanding the broader economic context is crucial for accurate analysis.
Overestimating the importance of past performance is a pitfall. While past performance can offer insights, it’s not a reliable predictor of future returns. Focus on the company’s current position and future prospects.
Finally, neglecting risk management can be costly. Diversification and proper position sizing are essential to mitigate potential losses. Don’t put all your eggs in one basket.